

At some point in the project, the conversation inevitably reaches Finance. Investment in automation must be justified not with intuitions or with references to what other companies do, but with a clear and verifiable financial analysis.
This guide proposes a structured way of estimating the ROI of a process automation project, using replicable formulas and examples representative of different types of companies.
In practice, the return on automation is often calculated incompletely. Relevant cost components, such as the opportunity cost of internal equipment, are often omitted and less obvious benefits, such as reduced errors, improved operational capacity or reduced regulatory risk, are underestimated. A rigorous methodology must capture all of these elements. [1]
The methodology: five sources of measurable value
The economic return of an automation project is usually concentrated in five main benefit categories. The advantage is that they can all be estimated using data that normally already exists within the organization.
Analyzed together, they allow us to build a reasonably complete estimate of the financial impact of the project.
Benefit 1: Time freed up in the process
It is the most immediate benefit and, generally, the easiest to quantify.
Formula
Annual savings =
Time saved per run (hours) ×
Number of executions per year ×
Hourly cost of the employee performing the task (€)
Example
A report consolidation process currently takes 3 hours and runs 52 times a year (once a week). If done by an analyst with a company cost of 35 €/hour:
3 × 52 × 35 = 5,460€ annual savings
To correctly estimate this benefit, it is important to measure the current process with some rigor. Informal estimates tend to underestimate real time by 30% to 50%, since they do not consider interruptions, searches for information or additional checks that are part of everyday work.[2]
The hourly cost should be calculated on the total cost to the company (gross salary plus contributions and benefits), not on the net wage. For example, a gross salary of 30,000€ usually represents an approximate business cost of 40,000—48,000 €, equivalent to about 22—27 € per hour considering an annual working day of 1,800 hours.[3]
Benefit 2: Reduction of errors and their associated costs
Manual processes generate errors with some frequency, and each error has a direct and indirect economic cost.
Direct costs include:
- the time needed to identify the error
- The correction time
- the economic consequences of the error (discounts, reprocesses, penalties)
Indirect costs are often less visible but equally relevant. When errors are frequent, teams tend to introduce additional verification steps that consume time even when no failure occurs.
Formula
Savings due to error reduction =
Errors per month ×
Average cost per error (€) ×
12 months ×
Expected reduction percentage (%)
Example
5 monthly billing errors
Average cost per error: €2,000
Estimated reduction after automation: 80%
Outcome: 96,000€ in annual savings
To estimate the average cost per error, you should include:
- time to identify the problem (2—4 hours in many cases)
- correction time and communication with customer or supplier (1—8 hours)
- direct financial impact (discounts, reprocesses or penalties)
In regulated sectors—such as banking, insurance, or pharmaceuticals—the costs associated with errors can increase significantly due to regulatory compliance requirements.
Benefit 3: Increased equipment capacity
One of the least visible effects of automation is the operational capacity it releases within the equipment.
If a team of five people currently spends 40% of their time on repetitive administrative tasks, automation can free up the equivalent of two full time people, without the need to expand the workforce.
Formula
Value of freed capacity =
(Hours released/Available hours per employee per year) ×
Annual cost of an employee
To this calculation can be added the potential value of the additional projects that the team can tackle thanks to that freed capacity.
In many cases, this second component turns out to be the most significant. For example, a sales team that automates its reporting can dedicate that time to business generation activities, such as contacting new potential customers or developing opportunities.
Benefit 4: Reduced required workforce growth
As a company grows, so does the administrative and operational burden. In the absence of automation, this often translates into a proportional growth of support staff.
Automation makes it possible to break that linear relationship. It is possible to increase the volume of operations in a 30— 50% without increasing the administrative head count by the same proportion.
The economic benefit is estimated by comparing:
- the projected workforce growth without automation
- the necessary growth once the process has been automated
The difference, valued at the total cost of a job —usually between 35,000€ and 55,000€ per year for administrative profiles, including selection, training and rotation—, constitutes the direct benefit.[4]
This component is especially relevant in tight labor markets, where hiring qualified personnel can be slow and expensive.
Benefit 5: Improved compliance and reduced operational risk
Automated processes are, by design, more traceable and auditable than manual processes.
Each action is automatically recorded with:
- Date and time
- responsible user
- history of modifications
- Exception log
This facilitates both internal audits and regulatory requirements.
The economic value of this improvement can be reflected in:
- reduction of time spent on audits
- lower likelihood of regulatory sanctions
- reduced effort needed to generate periodic regulatory reports (GDPR, SOX, PCI-DSS, and others)
For organizations that operate in highly regulated sectors — insurance, banking, health or food — this component can represent a significant part of the total return.
Construction of the complete financial model
A rigorous ROI model must consider both the estimated benefits and the total cost of the project.
Costs are usually divided into three main categories:

The combination of these costs with the five benefit categories described above makes it possible to build a reasonably complete financial estimate of the impact of automation.
Three illustrative examples of calculating ROI
Below are three representative scenarios that illustrate how to apply the methodology described above in organizations of different sizes. The examples are not intended to be universal, but to show how the different components of ROI are combined in real business contexts.
Example 1 — Service Company (SME)
80 employees | €8M in turnover
Automated process:
Management of commercial proposals and monitoring of the sales pipeline, previously managed through spreadsheets with weekly manual updating.
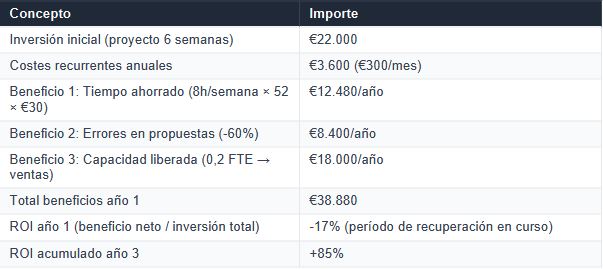
In this type of organization, the return usually accelerates after the second year, once the initial investment has been amortized.
Example 2 — Mid-market industrial company
350 employees | €45M in turnover
Automated process:
Purchase order management, approvals and supplier tracking. Previously, the process was distributed between ERP, emails and multiple departmental spreadsheets.
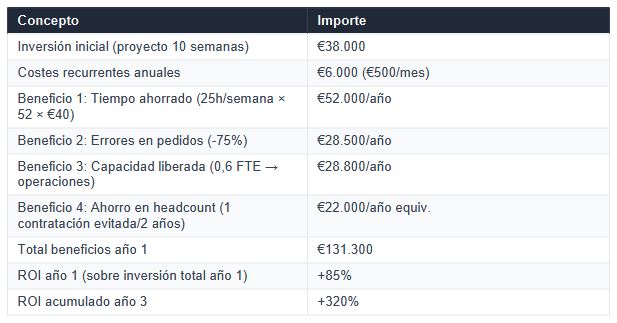
In companies of this size, the impact usually comes from the combination of operational savings and improved supplier management.
Example 3 — Enterprise (insurance industry)
1,200 employees | €200M in turnover
Automated process:
Medical authorization management system, previously managed through a partially manual process with validations in multiple non-integrated systems.

In large organizations, the volume of operations significantly amplifies the economic impact of automation.
Methodological note
The above examples are illustrative in nature and are based on common ranges of automation projects in companies in each segment.
Actual ROI can vary significantly depending on factors such as:
- the complexity of the automated process
- the level of adoption by users
- the quality of the implementation
- the degree of integration with existing systems
For this reason, it is advisable to build a specific financial model for each initiative before making investment decisions.
Common mistakes when calculating the ROI of automation
Two errors frequently appear when evaluating the return of these projects.
1. Limit the calculation to the time saved
Many estimates consider only the benefit associated with the time freed up (benefit 1), which often underestimates the actual impact of the project.
When other factors are incorporated — errors avoided, additional team capacity, or compliance improvements — ROI can multiply significantly.
It is not uncommon to find projects that seemed marginal from the perspective of time saved and that show several times higher returns when all the benefits are considered.
2. Ignore opportunity cost
Another common mistake is not including in the investment the internal time that the team dedicates to the project.
The effort of analysis, design, testing and adoption is part of the real cost of the initiative. In the same way, subsequent maintenance is often overestimated when compared to that of traditional legacy systems.
Next steps
To estimate the ROI of a particular process, the starting point is relatively simple. It's enough to gather some basic data:
- Current time per execution of the process
- execution frequency
- number of people involved
- average cost of associated errors
With this information, it is possible to build an initial financial model in a few hours, sufficient to assess more clearly the economic potential of automation.
Notes
[1] Methodological note: The formulas and examples presented in this article follow an ROI calculation methodology consistent with the standard frameworks of the Project Management Institute (PMI) and with the usual practice in process automation consulting. The numerical examples are illustrative; actual results depend on the specific context of each organization. SMES. (2021). A Guide to the Project Management Body of Knowledge (PMBOK® Guide), 7th Edition.
[2] Methodological note: The 30— 50% underestimate range in informal process time measurements is based on Yellow Glasses' experience in automation projects. It is consistent with APQC studies on differences between estimated and real time in administrative processes, but there is no single primary study that covers exactly this assumption with that segmentation.
[3] AEBYS. (2025). How much does it cost to hire an employee in Spain in 2025? Calculation and key factors. https://aebys.com/noticias/cuanto-cuesta-contratar-a-un-empleado-en-espana-en-2025-calculo-y-factores-clave/ — For an annual gross salary of 30,000€, the total cost to the company (including Social Security contributions: common contingencies 23.6%, unemployment 5.5%, professional contributions, FOGASA and training) is between 40,000€ and 48,000€ per year.
[4] Methodological note: The range of 35,000-55,000 € as the total annual cost for administrative profiles in medium-sized Spanish companies includes gross salary, Social Security contributions (∼30— 35% of gross), selection costs, initial training and estimated turnover. It is consistent with wage band data from the INE (Wage Structure Survey) and with references from portals such as InfoJobs or Randstad for mid-level administrative occupations in Spain.
Heading
Lorem ipsum dolor sit amet, consectetur adipiscing elit. Suspendisse varius enim in eros elementum tristique. Duis cursus, mi quis viverra ornare, eros dolor interdum nulla, ut commodo diam libero vitae erat. Aenean faucibus nibh et justo cursus id rutrum lorem imperdiet. Nunc ut sem vitae risus tristique posuere.

Artículos destacados
Explora nuestros últimos artículos y tendencias.
