

There is no management meeting where this issue is on the agenda. It doesn't have a line in the budget. It does not cause problems in the IT ticket system. And yet, it is consuming between 20% and 30% of the company's annual revenues in inefficiencies that no one has decided to assume: simply, no one has calculated them. [2]
It's called fragmentation of the technological ecosystem. Its most visible manifestation is that the data that the sales team needs is in the CRM; those that need operations, in the ERP; those that need finances, in the spreadsheet with which someone closed the month; and those that need direction to make decisions are distributed among the three, plus many other departmental applications that IT only partially knows.
According to MuleSoft, the average company manages more than 900 applications globally. [1] In the Spanish mid-market, companies with between 100 and 500 employees, the conservative estimate is between 100 and 500 applications. The percentage integrated together does not exceed 28%.
The problem isn't that the company has a lot of tools. The thing is that nobody knows exactly how many they have, which overlap, how many generate data that doesn't reach any central system, and how much it costs, in human time, to manually compensate for what non-existent integrations don't do.
The cost that doesn't appear on any line in the balance sheet
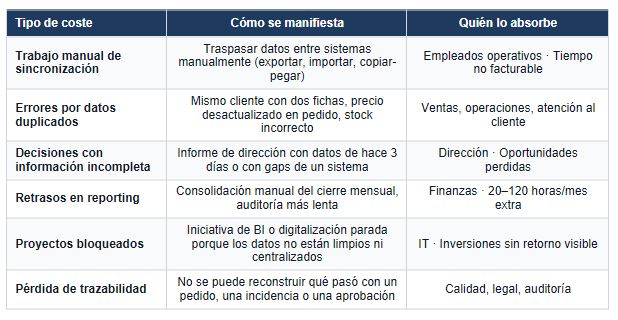
The cost of technological fragmentation is real, but invisible in standard financial statements. It does not appear as an expense item because it is distributed in the form of human time dedicated to manual coordination tasks between systems, errors derived from duplicate or outdated data, decisions made with incomplete information and transformation projects that are delayed because the data is not where it should be when it is needed.
IDC estimates that organizations lose between 20% and 30% of their annual revenues in inefficiencies caused by data silos. [2] For a company with €20 million in turnover, that represents between €4 and €6 million annually. For a €50 million one, between €10 and €15 million.
It is not an observable direct cost, but rather unused operational capacity: the order that took three days to process because someone had to transfer data from the ERP to the CRM manually; the monthly report that cost forty hours of consolidation instead of four; the revenue forecast that arrived late because the pipeline data was not synchronized with the production data.
Gartner adds an additional dimension: the cost of poor data quality—a direct consequence of fragmentation—amounts to an average of $12.9 million annually in large organizations. [6] In the mid-market, the estimate is between €500,000 and €2 million annually.
60% of organizations don't measure this impact. Not because it doesn't exist, but because measuring something that is distributed in human time over hundreds of processes requires a diagnostic effort that no one has prioritized.
Why this is a problem for the CFO, not the CTO
Technological fragmentation is often presented as an IT infrastructure problem. Systems aren't connected; IT should integrate them. This formulation has an underlying defect: IT rarely has the budget, time and priority to address a cross-integration project when the backlog of incidents and urgent projects already covers 120% of its capacity.
80% of IT leaders say that data silos hinder their organization's digital transformation. [3] The diagnosis is correct. But the solution is not in IT: it is in those who have the authority to budget the resolution of the problem as a strategic investment and not as an operating cost.
The CFO who calculates how many hours a month the finance team spends consolidating data from three different systems, multiplies them by the hourly cost of the profile that does it and projects that cost for twelve months, has a business case for integration. The CTO who argues that systems should be connected from a technical architecture perspective, no. The difference is not technical: it is one of language.
In Spain, less than 20% of SMEs use ERP or CRM integrated with their accounting system. [7] The most revealing fact is not the percentage of those that are not integrated, but the fact that most have not calculated how much this lack of integration costs them. Because, if they had calculated it, the decision to integrate would be easier.
The Inventory: The Question No One Has Answered
Before we talk about integrations, there's a more basic question that most midsize businesses can't answer exactly: How many apps is the company using right now?
Not the inventory that IT has recorded in its licenses. The real inventory: the SaaS tools that departments have contracted with a business card, the applications that teams use from their personal devices, the subscriptions inherited from previous projects that are still active because no one canceled them, and the tools that IT knows but is not actively managing.
51% of companies recognize that integration issues prevent them from taking advantage of their data. [9] The first step in solving that problem isn't choosing an integration platform. It's knowing what needs to be integrated.
Without this inventory, any integration project starts with an incomplete scope that will be discovered during implementation, generating the same pattern that describes 64% of technological projects: excess budget and time.
A technology ecosystem audit is not an IT project. It's a structured conversation with each department about what tools they use, what they use them for, what data they generate and where that data goes. It can be done in four weeks. The result is the map that makes possible any subsequent integration, automation or consolidation decision.
What has changed: why integrating today costs between 50% and 90% less than five years ago
Until a few years ago, integrating systems in a medium-sized company required a customized development project: requirements analysis, connector design, programming, testing and ongoing maintenance. The cost and time made the integration accessible mainly to large companies with their own IT teams.
iPaaS (Integration Platform as a Service) platforms and low-code automation tools have changed this calculation. MuleSoft estimates that these platforms reduce integration development time by 50% to 90% compared to traditional methods. [11] The average time to implement an iPaaS integration is 2—6 weeks, compared to 3—9 months via custom development.
The global data integration market reached €14.1 billion in 2024 and is projected to grow to €39.2 billion in 2030. [8] For the medium-sized Spanish company, this means that connecting the CRM with the ERP, or the reservation system with the billing system, or online sales with physical inventory, has gone from being a six-month project and €80,000 to a four-week project and a considerably lower cost.
The obstacle is no longer technical or economic in most cases. It's prioritization: someone has to decide that solving fragmentation is more important than the next project on the list.
Spain currently has Digital Kit grants of up to €29,000 per company for digitalization and integration projects. [5] The market for integration tools grew 23.4% in 2024. [4]
The conditions have never been more favorable for medium-sized Spanish companies to solve a problem that has been accumulating in silence for years.
The problem that is not on the agenda but is on the balance sheet
Technological fragmentation does not generate a red alert on the management dashboard. It has no clear responsibility because its consequences are distributed across all departments. It doesn't appear in strategic conversations because it's confused with the usual operational noise.
But 80% of IT leaders say that silos prevent digital transformation. [3] 68% of organizations cite them as their biggest strategic concern. IDC estimates its cost between 20% and 30% of annual revenues. And Cherry Bekaert identifies the lack of integration between CRM and ERP as the source of 70% of visibility problems in the commercial pipeline. [10]
The first useful question isn't “which integration platform do I choose?” , but “how much is it costing us not to have connected systems?” The answer to that question, calculated in human hours of manual work and in decisions made with incomplete data, is usually sufficient to put integration on the agenda.
References
1] MuleSoft (Salesforce). (2024). 2024 Connectivity Benchmark Report. MuleSoft.
The average global company manages more than 900 applications; only 28% are integrated with each other. In the mid-market segment (100—999 employees), the number of applications is substantially lower, but the integration percentage is even lower. This article uses a conservative estimate of 100—500 applications for the Spanish mid-market.
[2] IDC. (2024). The Cost of Disconnected Data in the Enterprise. IDC Research.
IDC estimates that organizations lose between 20% and 30% of their annual revenues due to inefficiencies caused by data silos. For a company with €20M in turnover, this equates to €4M—€6M annually.
[3] MuleSoft (Salesforce). (2024). 2024 Connectivity Benchmark Report. Op. cit.
80% of IT leaders say that data silos hinder digital transformation. 68% cite them as their biggest strategic concern.
[4] Gartner. (2024). Magic Quadrant for Integration Platform as a Service, Worldwide. Gartner Research.
The global iPaaS market reached $8.5 billion in 2024, with an annual growth of 23.4%.
[5] ONTSI/Red.es. (2024). Digital technologies in the company 2023. National Observatory for Technology and Society.
Only 26% of medium-sized Spanish companies have good digital health. 74.2% of SMEs have a basic level of digital intensity. Only 13.9% analyze big data in a systematic way.
[6] Gartner. (2023). Gartner Data Quality Market Survey. Gartner Research.
The average cost of poor data quality amounts to $12.9M per year in large organizations. In the mid-market, the estimate is between €500,000 and €2M. 60% of organizations don't measure this impact.
[7] Qonto/Channel Partner. (2025). Use of CRM and ERP in Spanish SMEs. Channel Partners.
Less than 20% of Spanish SMEs use ERP or CRM integrated with their accounting system.
[8] ERP Software Blog. (2025). Data Integration in 2026: AI Agents, Market Growth, and What IT Leaders Need to Know.
The global data integration market reached €14,100M in 2024 and projects growth to €39,200M in 2030 (CAGR 18.5%).
[9] AppConnect. (2026). 30+ Enterprise Integration Statistics & Trends for 2026.
51% of companies recognize that integration problems prevent them from taking advantage of their data. 99% face data complexity challenges.
[10] Cherry Bekaert. (2025). The Cost of Data Silos: Why CRM-ERP Integration Matters.
The lack of integration between CRM and ERP is the source of 70% of visibility problems in the commercial pipeline.
[11] MuleSoft (Salesforce). (2024). 2024 Connectivity Benchmark Report. Op. cit.
Low-code and iPaaS platforms reduce integration development time by 50% to 90%. The average implementation time is 2—6 weeks compared to 3—9 months with traditional development.
Heading
Lorem ipsum dolor sit amet, consectetur adipiscing elit. Suspendisse varius enim in eros elementum tristique. Duis cursus, mi quis viverra ornare, eros dolor interdum nulla, ut commodo diam libero vitae erat. Aenean faucibus nibh et justo cursus id rutrum lorem imperdiet. Nunc ut sem vitae risus tristique posuere.

Artículos destacados
Explora nuestros últimos artículos y tendencias.
