

74.2% of Spanish SMEs have a basic level of digital intensity. [8]
This implies something very concrete: most of them do not have a data engineer, nor do they have a dedicated data analyst. And, in many cases, the person who will end up maintaining the Business Intelligence tool will be someone from the finance, operations or IT team, with responsibilities other than reporting.
This is the starting reality that many Power BI, Tableau or Looker Studio comparisons don't reflect.
Most analysis focuses on functionalities, types of graphics or analytical capacity, assuming that whoever implements the tool also has the resources and knowledge to exploit it to the fullest. But in the midsize company without a data team, the key question is another:
Who is going to keep this when the consultant who implemented it is gone?
This article evaluates all three tools based on that criterion. With prices updated as of March 2026, with Gartner's positions as a reference and with an approach based on five decision criteria that no vendor quantifies in their commercial materials.
NOTE
Methodological notice: The prices quoted correspond to the official pages of each platform as of March 2026 and may vary. References to Gartner are based on the Magic Quadrant 2025. None of the companies mentioned have participated in the development of this content.
The three tools in context: who leads them and why it matters
Power BI, Tableau and Looker Studio are the three most used Business Intelligence tools in midsize businesses. All three appear as leaders in the Gartner Magic Quadrant for Analytics and BI Platforms 2025 —Power BI for the 18th consecutive year and Tableau for the 13th— [1], although it should be noted that Looker Studio and Looker (Google's complete platform) are different products, with very different capabilities and cost models.
Power BI has more than 30 million monthly active users. [11] It is, by far, the most common tool in corporate environments, largely due to its integration with Microsoft 365. In many companies, the starting point is already covered: Power BI Desktop is free and Power BI Pro can be included in existing licenses such as E5.
Tableau, meanwhile, was acquired by Salesforce in 2019 for $15.7 billion, making it the natural choice for organizations that already operate within that ecosystem.
Looker Studio —formerly Google Data Studio— occupies a different place: it's free in its basic version and is usually the logical choice for companies that work on Google Workspace. However, their reach is more limited when compared to complete BI platforms.
The Five Criteria Vendors Don't Measure
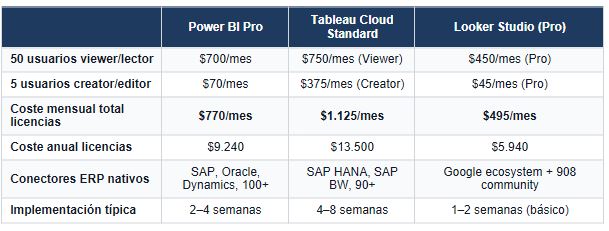
1. The actual cost to 50 users (not the cover price)
The entry price of each tool is known: Power BI Pro is around $14/user/month [2], Tableau Creator is 75 $/user/month [3] and Looker Studio is free in its basic version [4].
But that data, by itself, does not reflect the real cost.
As usage grows—more users, more datasets, more complexity—other factors come into play: additional licenses, processing power, infrastructure, maintenance, and support.
And that's where the difference between tools begins to be significant.
2. The learning curve for the profile that will keep it
The real difference between these tools is not only in what they allow you to do, but in who can keep them on a daily basis.
Looker Studio has the lowest learning curve. Its drag-and-drop interface, without complex proprietary language, allows you to build functional dashboards in a few hours with basic knowledge. But that simplicity also marks its limit: when you need to go beyond what native components offer, you need to resort to SQL or external connectors. [7]
Power BI is somewhere in between, especially for profiles used to Excel. Tools such as Power Query (for data transformation) and the DAX language (for calculations) require learning, but follow a familiar logic for financial or analytical profiles. In both G2 and Gartner Peer Insights, DAX consistently appears as the primary barrier to entry. [12]
Tableau presents the most demanding curve when it comes to building advanced analytics. Although its interface is intuitive for basic exploration, functionalities such as LOD (Level of Detail), table calculations or Tableau Prep require specific training. It's no accident that the “steep learning curve” is one of the most repeated observations in user reviews. [6]
3. Integration with the ERP and existing data sources
In a midsize company, the ability to connect to existing systems often outweighs any other functionality.
Power BI stands out for its integration with the Microsoft ecosystem and for its wide catalog of native connectors: SAP HANA, SAP BW, Oracle, Dynamics 365, Salesforce, Snowflake and more than 100 additional sources. [11] In addition, tools such as the On-premises Data Gateway allow you to update data automatically without exposing the database, which is a good fit for hybrid environments typical of many Spanish companies.
Tableau also offers a wide range of connectors (more than 90), including SAP and Oracle, as well as universal access via JDBC/ODBC. [3] Its integration with Salesforce is especially deep, with pre-configured dashboards that make it the natural option for companies operating in that ecosystem. In other environments, the integration is strong, although it usually requires more configuration than in Power BI within Microsoft environments.
Looker Studio, on the other hand, is clearly optimized for the Google ecosystem: GA4, Google Ads, BigQuery, YouTube or Google Sheets. [4] When it comes to connecting to an external ERP, the usual pattern is to use BigQuery as an intermediate layer. This involves loading the ERP data into BigQuery and building the visualization from there.
This architecture works, but it introduces additional complexity - and an associated cost - that is not evident in the positioning of Looker Studio as a free tool.
4. What happens when someone leaves the company
This is one of the most ignored criteria in evaluation... and one of the most problematic criteria months after implementation.
Dashboards aren't neutral: they depend on who builds them. If that person hasn't documented the data model, the sources, and the logic of the calculations, the result is a black box that's hard to maintain when requirements change.
All three tools provide mechanisms to avoid this dependency. Power BI allows you to export the file .pbix, Tableau the workbook .twbx and Looker Studio stores reports in Google Drive within the company's workspace. They also have permission systems so that access does not depend on a single account.
But these capabilities don't solve the problem on their own. They require conscious configuration from the start.
The most effective — and least common — practice is to document the data model as part of the project, not as a subsequent task. Without that documentation, any tool ends up generating dependence on specific people.
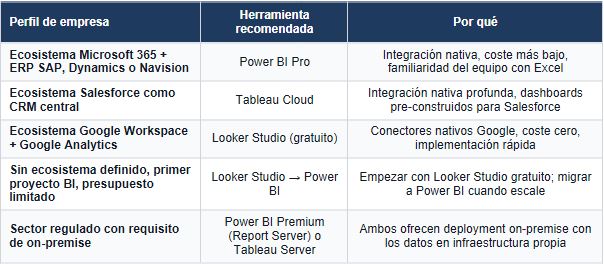
5. The company's existing technological ecosystem
In many cases, this criterion resolves the decision before entering into functional comparisons.
If the company operates on Microsoft 365 and uses Dynamics, SAP or other systems with native connectors, Power BI is usually the natural choice: the integration is direct, part of the licenses may already be covered and the learning curve is shorter for profiles used to Excel.
When the business core is in Salesforce, Tableau has a structural advantage because of its native integration with that ecosystem.
And if the company works primarily on Google —Gmail, Drive, Analytics, Ads—, Looker Studio becomes the logical starting point. [9] [10]
Rather than a question of functionality, the choice usually depends on the fit: the tool that best integrates with the existing ecosystem is, in practice, the one that offers the most value with the least friction.
What no tool solves on its own
All three tools visualize data. None of them cleans them, integrates them, or automatically builds a coherent model.
In fact, 65% of BI projects that don't achieve the expected ROI fail in the data preparation phase, not in the choice of the visualization tool. [1]
Choosing between Power BI or Tableau without having previously defined the data sources, the model and the responsibility for reporting is to start at the end.
The correct order is different.
First, understand what business decisions require information. Then, identify what data supports them and where they are located. From there, clean and structure that data into a consistent model. And only then, choose the tool that best presents them for the user profile that is going to use them.
Because a BI tool on cluttered data doesn't solve the problem.
It makes it visible.
In the midsize company without an internal data team, the value of a successful implementation doesn't lie in the tool chosen. It is in the design of the data model, in the clarity about the sources and in the training of the people who are going to maintain the system on a daily basis.
No software does that
References
[1] Gartner. (2025). Magic Quadrant for Analytics and Business Intelligence Platforms, 2025. Gartner Research. Microsoft has been named a Leader in the Gartner Magic Quadrant for Analytics and BI Platforms for 18 consecutive years, with the highest position in Ability to Execute and Completeness of Vision for the seventh consecutive year (June 2025). Tableau (Salesforce) has been a leader for 13 consecutive years in the same quadrant.
[2] Microsoft Power BI. (2026). Pricing. https://powerbi.microsoft.com/en-us/pricing
— Power BI Desktop: free (Windows only, no cloud publishing). Power BI Pro: $14/user/month (included with Microsoft 365 E5). Power BI Premium Per User: $24/user/month (100 GB per dataset, 48 refreshs/day). Power BI Premium Capacity: Starting at $4,995/month (P1, shared capacity). Prices rose in April 2025, the first rise in nearly a decade.
[3] PricingNow. (2026). Tableau Cost — Business Software Pricing. https://pricingnow.com/question/tableau/
— Tableau Cloud Standard: Viewer $15/month, Explorer $42/month, Creator $75/month. Tableau Cloud Enterprise: Viewer $35/month, Explorer $70/month, Creator $115/month. Tableau Server (on-premise): starting at $35/user/month (Creator). Additional costs: implementation $10K—$100K; training $1,200—$2,000/course.
[4] Catch/Beast Metrics. (2026). Looker Studio Pricing. https://www.catchr.io/post/a-detailed-guide-to-looker-studio-pricing
— Looker Studio: free. Looker Studio Pro: $9/user/project/month (governance, shipping scheduling, support). Looker (full platform): $36,000—$360,000+/year, average ~$150,000/year according to Vendr. Looker Studio's community connectors exceed 900, many of which are paid.
[5] Synapx/Agolution. (2025). Power BI Licensing Changes 2025. https://www.synapx.com/power-bi-license-changes-coming-april-2025-what-you-need-to-know/
— After the price increase in April 2025, Power BI Pro went from $10 to $14/user/month (+40%). Power BI Premium Per User went from $20 to $24/user/month. The upload was the first since the product was launched. Power BI Pro is still part of Microsoft 365 E5.
[6] G2. (2026). Tableau Pros and Cons. https://www.g2.com/products/tableau/reviews?qs=pros-and-cons
— The main complaints from Tableau users in G2 are the high cost (112 mentions), the steep learning curve (94 mentions) and the performance with large datasets (67 mentions). The main advantages are visualization quality (189 mentions) and analysis flexibility (143 mentions).
[7] Whatagraph/Dataslayer. (2026). Looker Studio Reviews 2026. https://whatagraph.com/reviews/looker-studio
— 38% of reviews report performance problems with large datasets. The most common limitations include a maximum of 5 blending fonts, the absence of native Row-Level Security, and lack of automatic shipping in the free version.
[8] ONTSI/Red.es. (2024). Digital technologies in the company 2023. https://www.ontsi.es/es/publicaciones/tecnologias-digitales-en-la-empresa-2023
— 74.2% of Spanish SMEs have a basic level of digital intensity. Only 13.9% analyze big data. The Digital Kit offers grants of up to €29,000 per company.
[9] Digitize your business.net. (2025). From Excel to real BI: implement Power BI or Tableau in a medium-sized company without hiring analysts. https://digitalizatuempresa.net/blog/de-excel-a-bi-power-bi-tableau-empresa-mediana/
— Comparative implementation analysis in a medium-sized Spanish company without an internal data team. Conclusion: Power BI is more accessible for the transition from Excel due to its integration with Microsoft and resources in Spanish.
[10] Ninja Reporting/Dataslayer. (2026). Looker Studio vs Power BI vs Tableau: Which tool is better? https://www.reportingninja.com/blog/looker-studio-vs-power-bi-vs-tableau-best-tool-comparison
— Independent comparison: Looker Studio for Google ecosystem, Power BI for Microsoft 365 and Tableau for organizations that prioritize advanced visualization.
[11] Microsoft Power BI. (2025). Microsoft Named a Leader in the 2025 Gartner Magic Quadrant for Analytics and BI Platforms. https://powerbi.microsoft.com/en-us/blog/microsoft-named-a-leader-in-the-2025-gartner-magic-quadrant-for-analytics-and-bi-platforms/
— Power BI has 30 million monthly active users and includes native connectors for more than 100 sources. Copilot has been able to generate reports with natural language since February 2024.
[12] Gartner. (2024). Gartner Peer Insights: Microsoft Power BI Reviews. https://www.gartner.com/reviews/market/analytics-business-intelligence-platforms/vendor/microsoft/product/microsoft-power-bi
— More than 1,500 verified reviews. Advantages: integration with Microsoft and cost. Limitations: DAX complexity and performance in big data models.
Heading
Lorem ipsum dolor sit amet, consectetur adipiscing elit. Suspendisse varius enim in eros elementum tristique. Duis cursus, mi quis viverra ornare, eros dolor interdum nulla, ut commodo diam libero vitae erat. Aenean faucibus nibh et justo cursus id rutrum lorem imperdiet. Nunc ut sem vitae risus tristique posuere.

Artículos destacados
Explora nuestros últimos artículos y tendencias.
